Understanding Twitter Analytics
Twitter has its own set of analytics, go to https://analytics.twitter.com and you will be able to see all the analytics for your Twitter account. This is free and everyone has access to it.
But any analytics can be confusing if you are not use to them. Lets go over the main page of the Twitter analtyics. This is the first page you will land on when you go to their analytics and gives you your account overview.

The default sampling size is the previous 28 days. You will see the number of tweets you put out, total impressions, profile visits, mentions and followers. The green up or red down arrows indicate this months numbers as compared to last months numbers. As you can see I had 4.1% fewer tweets this month as the month before. This area gives you a nice summary of your activity. Below it are your "Top" highlights, like Top Tweet, Top Follower. You can scroll down and see data for previous months as well.
To get more specific in your analtyics, you need to look at the next section: Tweets.
Tweets will show you more specific information about your individual tweet activity, including clicks.
In the tweet section you can look at your data broken down per tweet.

Impressions are the number of times that tweet appeared in the Twitter newsfeed. Engagements are the number of times someone interacted with your tweet, either a mention/retweet/favorite/click. Engagement rate is the number of engagements divided by the number of impressions for that tweet. (Engagement rate can also be calculated by the number of engagements divided by the number of tweets, in some analytics).
You can get more information on individual tweets by clicking on the tweet and opening it up.

This can tell you where the click happened, on the link or hashtag, or on the image. It will also tell you if you got retweets, favorites and replies.
In this section you can sort by impression, engagement and engagement rate by simply clicking on the header. You can also look at what your top tweets are, which is based off the number of impressions.
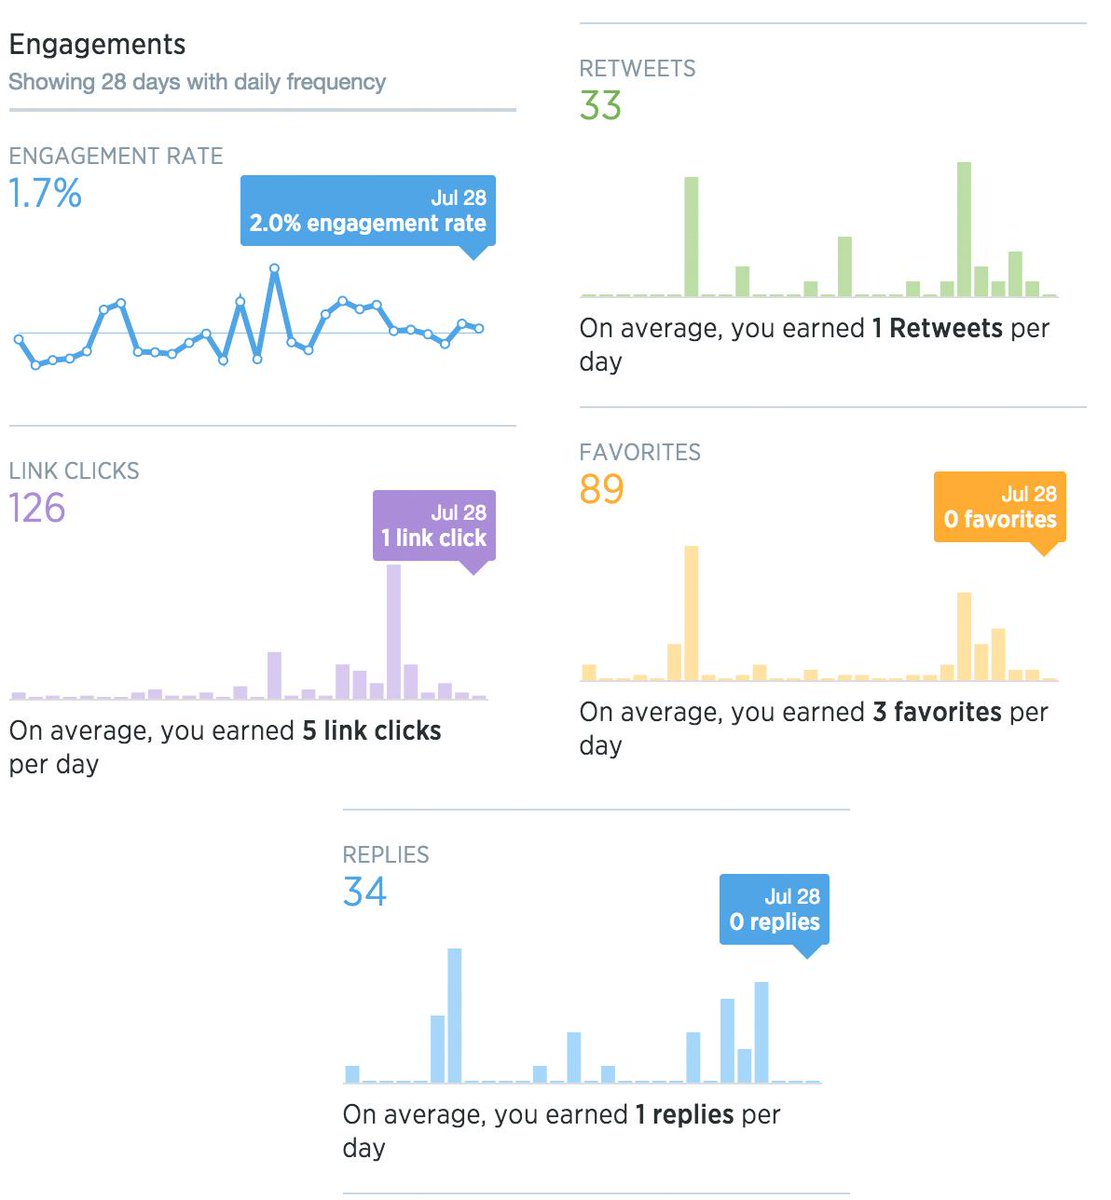
On the right hand side you will see summary graphs about your tweet activity.

This section breaks down your summary information into your most useful information. Clicks are a good number to pay attention to. This will show you how many times people have clicked a link on your Twitter feed.
The next section gives you information about your followers. This can be interesting, but in adult is a little less valuable.

It will tell you gender, interests, household income, marital status. The reason this will not be that useful is because out side of interests, which is based on twitter behavior, there is no real way Twitter can know any of the other information. Because Twitter does not gather, gender, income, marital status information in their system they are basing the information off an assumption based on tweet content and user behavior. The interests part can be valuable, except the interests are based off their categories and do not include adult content.
The summary and the tweets are the best sections to pay attention to when tracking your analytics and will give you the most comprehensive information.


Comments
oh boy I needed this one! thanks again @7veils!
Additionally, clicks in twitter means clicks on links as well as clicks on photos. So you should monitor your traffic by looking at twitter and google analytics.